regression: a data analysis api
from scideas software
regression api definition
regression api data preparation
The data to be analyzed must first be collated into a csv file. The first line must contain the variable names. Include the output variable in the file. Here is an example csv file for sales data.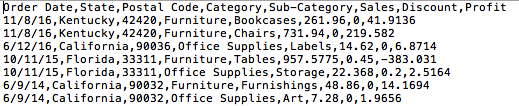
Once you have your csv file you need to encode the contents as a JSON string to use in the data POST field.
There are some very important considerations to be made in choosing data, don't just include all the data you have !
Do not include similar variables
Regression analysis does not work well if two or more similar variables are included. Similar here means correlated.In the csv file above the variables State and Postal Code would be highly correlated so we don't want to include them both. By using the ignore_variables POST field in the request we can tell the api to ignore the Postal code variable.
Dates
Regression analysis requires numeric data. The api will convert categoric variables, like State for example, into numeric variables. Every different value for the categoric variable will be converted to a different number.This will be done in the order new values are found in the data so in the above example Kentucky would be 1, California 2 etc. The order and number don't matter.
If dates were converted like this, since every date is different, every single date would be converted to a different number and this wouldn't be at all useful. You probably want to know how the month or the week in the year affect the outcome.
To help with this there is a convert_date_to POST field. By giving it the value of either week or month the api will convert a date variable to weeks (1 to 52) or months (1 to 12). It can recognise either US style mm/dd/yyyy or standard dd-mm-yyyy (or dd.mm.yyyy) and it will convert any field whose name includes the word "date".
Alternatively prepare your own field of numeric months, weeks, hours or whatever and call the variable Months etc, anything without the word "date".
Code example
See here for a PHP code example.regression api result interpretation
Standardized coefficients
This is an array of the coefficients determined by the regression analysis. These should only be understood as indicating the relative influence of each variable. For example a value of 20 for variable A and a value of 1 for variable B means that variable A makes 20 times more difference to the outcome than variable B. It does not mean that if you double variable A the outcome will change by 40 times.The sign of the coefficient indicates the direction of influence. For a negative coefficient, increasing the variable value will tend to lower the outcome value.
Prediction mean accuracy
Most of the data rows are used in the analysis. Some are kept back and used to test the model created against the actual outcome values supplied. This gives an indication of how successful the analysis has been. The nearer the prediction_mean_accuracy value is to 100 the more the model can be trusted.Summary
This is a text summary for each variable included in the analysis. It simply attributes an adjective to different ranges of coefficient value.Where appropriate the summary also includes an indication of the direction of influence; does a higher variable value make the outcome higher or lower ? For categoric variables that have been encoded to numeric values, this indication can only be made for binary categories, for example sex (male or female) or perishable goods (yes or no).

